


Tag: Data
Help Researchers Spot Suspicious Blips In Health Data With Adler Zooniverse
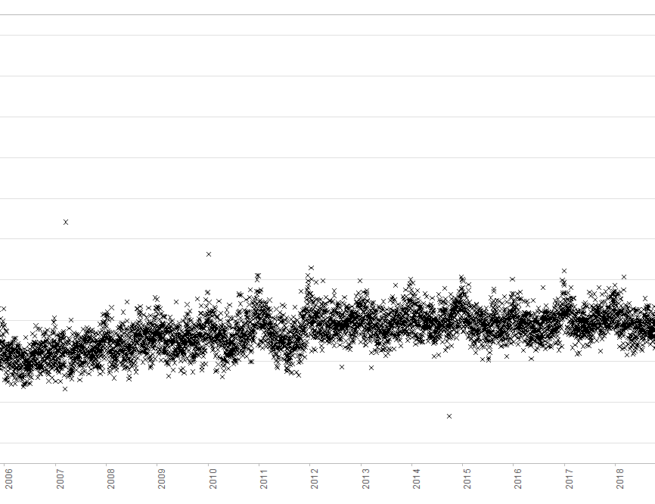
Image Caption: Adler Zooniverse project Health Record Hiccups analyzes graphs like this one to look for unexpected changes in health data over time. I’m not a statistician, a doctor, an elected official, or a very-recent-historian, but I would bet at least a couple of my vital organs that most of us have paid more attention to […]